In London, the city’s most crime-ridden areas have been identified, with alarming statistics highlighting a surge in thefts, assaults, and drug offenses under Mayor Sadiq Khan’s administration. These revelations have shed light on the dangerous underbelly of the city, particularly in neighborhoods like Leicester Square, Covent Garden, and the surrounding tourist-heavy regions.
**Uncovering London’s Dark Corners: A Close Look at Crime Statistics**
One of the most alarming findings is the concentrated violence and sex crimes in the Westminster district, with a staggering 1,302 attacks, rapes, or sexual assaults reported in 2024 alone. This equates to a rate of 1,645 violent crimes per 100 acres, making it the highest in the city. This area, known for its luxury establishments and bustling streets, has also topped the charts for drug-related crimes, ranging from minor cannabis possession to large-scale drug trafficking operations.
**Hotspots of Criminal Activity: A Closer Look**
A detailed analysis of nearly 5,000 districts across London has revealed a small area straddling Oxford Street and parts of Soho as the epicenter of thefts. This zone recorded close to 6,150 thefts in the past year, with a high prevalence of scooter-riding thieves snatching phones from unsuspecting pedestrians and making quick getaways. The theft rate in this region is a staggering 8,450 thefts per 100 acres, painting a concerning picture of rampant criminal activity in the heart of London.
As these distressing figures continue to climb, concerns about public safety have reached new heights. Incidents of teenagers being stabbed in broad daylight, unruly youths hijacking police vehicles, and brazen thieves preying on tourists have become all too common in the city’s most vulnerable areas.
**Behind the Numbers: Mapping Crime Rates in London**
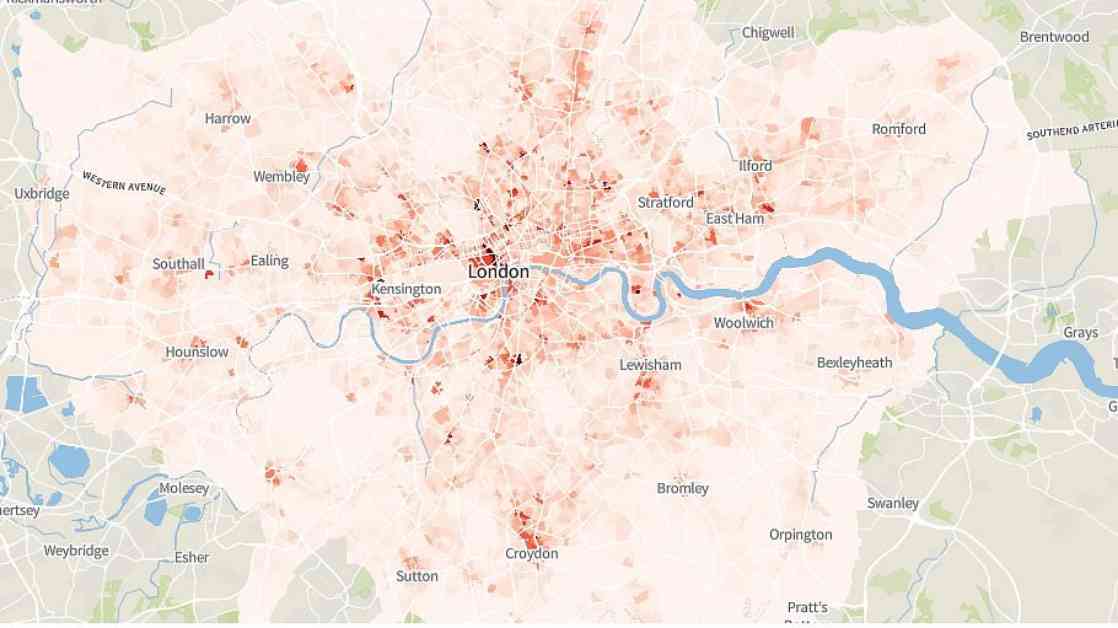
To provide a visual representation of crime rates across various neighborhoods, an interactive map has been developed, showcasing crime data by ‘Lower Layer Super Output Areas’ (LSOAs). The map displays varying shades of red to indicate higher crime rates per 100 acres, offering a comprehensive overview of the city’s most dangerous zones. All crimes reported to the Metropolitan or City of London police forces, irrespective of arrests or convictions, are included in the database.
However, it is essential to note that crimes committed on public transport or at transport hubs are excluded from the data, as they fall under the jurisdiction of the British Transport Police. The map also distinguishes between different electoral wards within London’s 32 boroughs, highlighting the unique crime statistics of each area.
As incidents of violence, theft, and drug-related crimes continue to plague London’s streets, residents and visitors alike are urged to exercise caution and remain vigilant in these high-risk areas.
The sense of security that London once provided is now marred by a shadow of fear and uncertainty, as criminal elements thrive in the city’s most vulnerable neighborhoods. The need for proactive measures to combat crime and ensure public safety has never been more apparent.


